Table of Contents
Introduction
This page will instruct you to install and configure Eclipse as your MidiBox Integrated Development Environment (IDE). Eclipse is supported on multiple platforms, including Windows, Linux and Mac OS. The long-term goal is for this wiki page to provide instruction for all platforms. As it stands today, these instructions are written for use on the following operating systems:
- Windows XP Professional SP3
- Windows 7 Ultimate SP1
- Ubuntu Linux 10.10
The following software versions were used when generating these instructions. As these free and open-source tools evolve, the user interfaces may change and appear different from those displayed here.
- Java Runtime Environment: Sun Java 5 Update 22
- Eclipse: Helios Service Release 2, build ID 20110218-0911
- MSYS: 1.0.11
- CodeSourcery G++: Lite 2010.09-51
- OpenOCD:
Install Eclipse
Eclipse is a Java application, and therefore requires you to have a Java Runtime Environment (JRE) installed on your computer. The recommended JREs for use with Eclipse, handily sorted by computer operating system, can be found on this web page. Download the JRE and install according to the JRE provider's instructions.
Download Eclipse from this web page. Eclipse comes in a few flavors. For use as a MidiBox IDE, you want to download “Eclipse IDE for C/C++ Developers”. This Eclipse package includes the C/C++ Development Tooling (CDT), which makes Eclipse C and C++ friendly. Be sure to select the correct version for your computer's operating system (32- or 64-bit).
Installation is very easy: simply extract the archive you downloaded from the Eclipse website and copy the contents to your computer's hard drive. Because there is no formal installation, you will need to generate your own desktop shortcuts, if desired.
Optional Eclipse Workspace Configurations
Open Eclipse. You may be prompted to select a workspace. If unfamiliar with Eclipse, you should just use the default workspace location for now.

If you are presented with the 'Welcome' screen, click the “Go To the Workbench” link.

You should now be presented with the Eclipse workbench. To configure your workspace, select 'Preferences' from the 'Window' menu.

You are now presented with the 'Preferences' window where you will configure your workspace.
By default, Eclipse will build a project every time you open the project or switch to it. This “feature” can sometimes be extremely annoying. To disable this behavior, select General→Workspace in the 'Preferences' window and uncheck the 'Build automatically' option.

You can define Environment variables that will only be used by Eclipse. You can use this feature instead of modifying the operating system environment variables. To define Environment variables, select C/C++→Build→Environment in the 'Preferences' window and click the 'Add' button on the right. These environment variables will automatically apply to all projects in the workspace, and you can override them on a per-project basis by modifying the projects' configurations.

You can also modify the PATH environment variable that will be used within Eclipse. This is particularly useful if you want to switch between different toolchains, or use a particular toolchain for one of your projects.
For Windows, add a variable 'Path' and give it a value something like the following:
C:\msys\1.0\bin;C:\Program Files\CodeSourcery\Sourcery G++ Lite\bin;${Path}
For Linux, add a variable 'PATH'
${HOME}/mios32_toolchain/bin:${env_var:PATH}
Note the value you enter for the PATH variable may be different than the above depending upon where you installed the MidiBox toolchain.
Setup Eclipse as MIOS32 IDE
It is assumed that you have completed the MIOS32 toolchain installation for your particular system (either Windows or Linux) and have successfully obtained the MIOS32 source code prior to completing the instructions that follow.
Configure Your Workspace
The Eclipse project files in the MIOS32 repository are created to make use of a relative path to the MIOS32 directories. This is required because the MIOS32 code can be located anywhere within a developer's file system. We will create the path variable in our workspace which is referenced by the project file, allowing Eclipse to locate all the directories specified by the project file. In the 'Preferences' window, select General→Workspace→Linked Resources from the tree in the left-hand pane. Click the 'New…' button on the right. Give the variable the name 'MIOS32_ROOT', then specify the location of your MIOS32 checkout on your computer (this may be something like 'C:\subversion\mios32\trunk', or for Linux '~/mios32'). You can also select the directory by browsing to it after clicking the 'Folder…' button.

Import the Template Projects
Select 'Import…' from the 'File' menu or right-click in the whitespace of the Project Explorer pane on the left and select 'Import…' from the menu that appears.


You will be presented with the 'Import' window. Expand 'General' and select 'Existing Projects into Workspace', click 'Next >' button.

Click the 'Browse…' button next to 'Select root directory'. Browse to your MIOS32 directory and select the folder \apps\templates\app_skeleton_cpp, click 'OK' button. The app_skeleton_cpp project should appear in the 'Projects' field of the 'Import' window, its checkbox should be checked. Click 'Finish' button.


The app_skeleton_cpp project should now appear in the Project Explorer pane in Eclipse. If you've done everything correctly, you should be able to browse the MIOS32 source code in the app_skeleton_cpp project's linked directories. Repeat the above steps to import the app_skeleton project into Eclipse.
Build a Project
If you have performed all steps correctly, you should be ready to build this project. Select the app_skeleton_cpp project, right-click and select 'Build Project'. You can also select 'Build Project' from the 'Project' menu, or use the keyboard shortcut 'CTRL+B'.

The console output should be visible in the 'Console' pane of Eclipse.

Some Useful Things to Observe
The app_skeleton_cpp build produced a warning, you can see this warning is highlighted in red in the console pane. Eclipse is able to parse the console output of the build and highlight warnings and errors for you. Even better still, you can double-click the warning in the console pane. The file that contains the source of the warning will be found and opened, and you will be taken to the exact line of code that generated the warning.

Even more information is available to you… notice the icon next to the line of code that generated the warning. This icon also appears on the file icon in the Project Explorer tree. In the right-hand panel is an outline of the code in this c module. The function that generated the warning also has the warning icon. If your compilation did not generate this warning, add something to the code that will generate an error during compilation (for instance, delete a semi-colon), then build the project. The build will hault once the error is detected, and you should be able to trace that error in the same ways that are described above for the warning.
Create Your Own Projects
Setup Eclipse to Debug MIOS32 Applications
This section documents how to setup and execute debug sessions using a JTAG interface to a midibox STM32 core module.
The following is used in this section:
core:…………….STM32
OS:………………windows 7 x64 WinXP should work the same use with OpenOCD 0.5.0 (non x64)
toolchain:……mios32_toolchain (mentioned in the wiki). Ensure that workspace environment PATH includes e.g C:\mios32_toolchain\bin
IDE:……………..Eclipse (Indigo) later versions will probably not work at this point
OpenOCD:…….0.5.0 x64 Download
GDB:……………..Yagarto (gdb version 7.3.1) later versions should workdownload
JTAG:…………….Amontec JTAGkey-tiny many other brands and types of JTAG interface are supported by OpenOCD
OpenOCD
Install OpenOCD
- Unpack the OpenOCD download to C:\OpenOCD.
External Tools Configuration
Open Eclipse:External Tools Configurations.

- Click pulldown on button pictured above
- Select “External Tools Configurations…”
- Click button (new configuration, pictured highlighted)
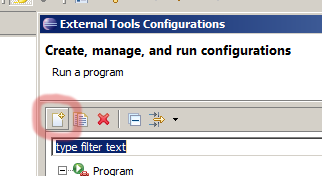
- Name: put “OpenOCD 0.5 (x64)” (or similar)
- Location: put “C:\OpenOCD\openocd-x64-0.5.0\bin\openocd-x64-0.5.0.exe”
- Working Directory: put path to root directory of projects that may use this debug setup e.g “W:\sw”
- Arguments: “-f C:\OpenOCD\openocd-x64-0.5.0\interface\jtagkey.cfg -f C:\OpenOCD\openocd-x64-0.5.0\target\STM32F1x.cfg” the first argument is the JTAG interface config file, the second is for the core chip.

GDB Debugger
Install Eclipse GDB Plugin
- Open “Install” dialog: Help→Install New Software…
- Work with: pulldown and select “Indigo - ht tp:/download.eclipse.org/releases/indigo”
- In the tree shown, open branch at “Mobile and Device Development”
- Click the box beside “C/C++ GDB Hardware Debugging”
- Click “Next” at bottom of dialog
- Follow the prompts to install the plugin
Install GDB
- Download yagarto: Here
- Unpack yagarto to C:\yagarto
Debug Configuration
This config will have the function of simply running the debugger with a project that is already flashed in the midibox core (it may have been flashed using MIOS Studio in the usual way). It does not actually build the program or flash it. Frequently you'll want to run the debugger for various test cases without changing the program. This does it quickest.
- Open Debug configurations (click pulldown on button pictured below)

- Select “Debug Configurations…”
- Name: type “YourProjectName debug” appropriately.
- To the left of the “Apply” button is a link: “Select other..” click it.
- Make sure “Standard GDB Hardware Debugging Launcher” is selected. Click “Ok”.
- Beside the link it should say “Using Standard Hardware Debugging Launcher”
- Main tab:→
- C/C++ Application: e.g. “W:\sw\aMyProj\project_build\project.elf” (i.e full path to project *.elf file)
- Project: click browse button and select from list of workspace project names
- Select “Disable auto build” on this tab, to suppress the Make operation.
- Debugger tab:→
- GDB Command: “C:\yagarto\bin\arm-none-eabi-gdb.exe” (i.e full path to gdb executable)
- Command Set: select “Standard(Windows)”.
- Protocol Version: select “mi”.
- Check “Verbose console mode”.
- Uncheck “Use remote target”
- Startup tab:→
- “Reset and Delay” is checked, “Halt” is checked
- Text box in the “Initialization Commands” section:
target extended-remote localhost:3333


b main


monitor soft_reset_halt


monitor sleep 500


continue


clear main
- “Load Image” unchecked
- “Load symbols” checked
- “Use project binary” selected. Should show path to project.elf
- Source and Common tabs are not altered.
- Click “Apply” to save the configuration.
Running the Debug Configuration
In this procedure we will debug by building the application and flashing it into the core using MIOS Studio, do this first then…
- Make sure OpenOCD process is running:
- Click pulldown on button pictured above and click on “OpenOCD 0.5 (x64)” item.

- Open Debug configurations (click pulldown on button pictured below)
- Select “MyProject debug”
- Cursor will stop at main() shown below. There will be all sorts of esoteric messages in the console relating to the workings of GDB.
- Run menu has all sorts of commands Resume,Suspend,Step Into,etc, etc.
- Experiment by placing a breakpoint in a routine that you know should execute: right click→Toggle Breakpoint.
- Resume execution, until cursor stops at the line of code where the breakpoint is: The Variables frame shows the values of local variables.
Flash/Debug Configuration
In this configuration the app will be built, then flashed into the core, then loaded ready to execute.
- Open Debug configurations (click pulldown on button pictured below)
- Select “Debug Configurations…”
- Copy the previous debug only configuration from the last section:
- (re)Name it “MyProject flash,debug”
- Main tab→select “Enable auto build”
- Debugger tab→ same as before.
- Startup tab→ same except for contents of Initialization Commands text box:
target extended-remote localhost:3333


monitor reset halt


monitor wait_halt


monitor poll
as well as in the “Run Commands” text box:
monitor flash probe 0


monitor stm32f1x mass_erase 0


monitor flash write_image MyProjectFolder/project_build/project.bin 0x08000000 bin


disconnect


target remote localhost:3333


monitor soft_reset_halt
- Click apply to save configuration settings
Running the Flash/Debug Configuration
- Make sure OpenOCD is running (see previously)
- Click the pull down and select the item “MyProject flash,debug”
- Project will build
- GDB diagnostics will appear (black, commands are in red).
- There will be a significant pause during the actual flash programming operation (see pictured below, in a project called AqCntSVN)

- The program will halt. Activate “Resume” from the run menu or debug toolbar and the program will run from as if hard reset, that is the bootloader pulsing of the LED will happen followed by execution of the app.
- You are now debugging and the program will halt on break points, allow single stepping, inspection of variables, etc, etc.